How Does the Government Tax, Spend, and Borrow?
Where the money goes, where it comes from, and what fiscal policy can and cannot do
Start Here: $20 Billion a Day
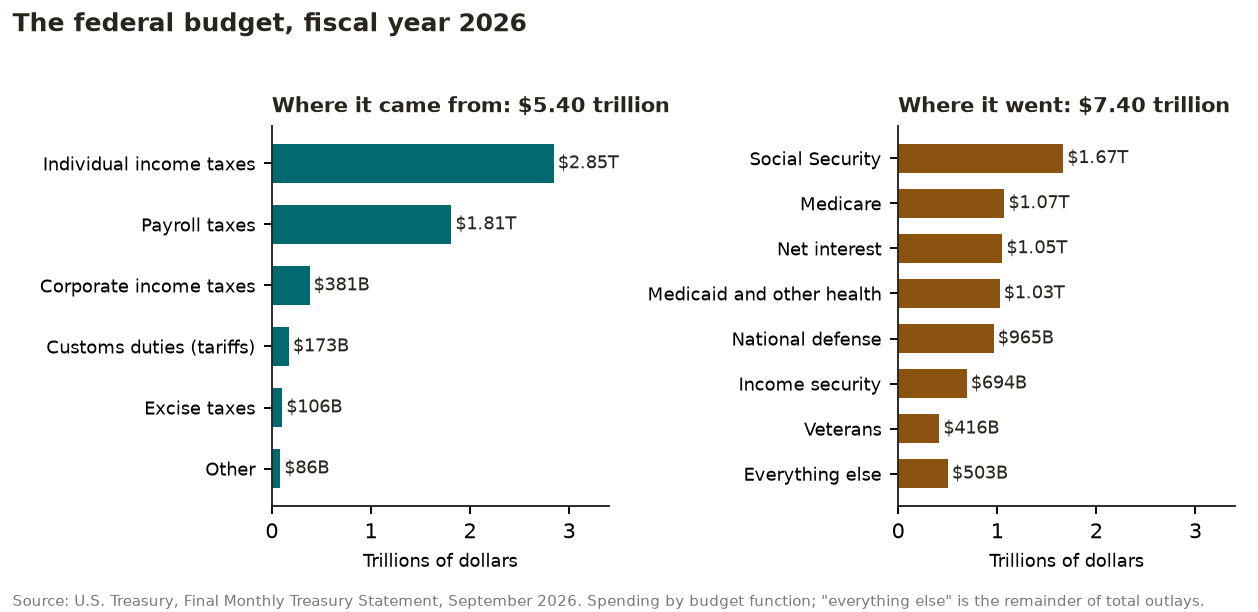
In the fiscal year that ended on September 30, 2026, the federal government spent about $7.4 trillion. That is roughly $20 billion every day, or about $22,000 for each person in the country. It collected about $5.4 trillion, roughly $15 billion a day. It borrowed the difference, almost $2 trillion, by selling bonds.
Those numbers can feel too large to mean anything. But each one is the sum of choices that touch ordinary lives: a retiree’s Social Security check, a soldier’s pay, the tax taken out of a paycheck, the interest earned by a family that owns a Treasury bond.
This reading follows the Macro Foundations steps. Define It asks what fiscal policy is, what the government buys, where its money comes from, and how taxes differ. Measure It shows how large the budget is, who pays, and how the Treasury borrows. Explain It shows what fiscal policy can do in a recession or a bout of inflation, how some of it works on autopilot, whether it works, whether the budget should be balanced by law, and what economists look for in a good tax system.
Two earlier readings go deeper on two of these questions. Should Government Fight Recessions? covers multipliers, lags, and the case for and against stimulus. Is the National Debt a Problem? covers how much debt is too much. This reading recaps both briefly and spends more time on taxes, borrowing, and the rules that govern the budget.
The framework from the Foundations readings applies here too. Taxes change prices: a tax on work lowers the reward for working, and a tax on gasoline raises the price at the pump, so taxes change what people choose to do. Government programs don’t face profit and loss the way businesses do, so something else has to tell them when a program costs more than it is worth. In a democracy, that job falls to budgets, voters, and rules. And public debt is a claim on future taxpayers, a kind of property right that bondholders count on and that today’s voters can create without asking tomorrow’s.
Define It: What Is Fiscal Policy?
1 Taxing and spending, not interest rates
Fiscal policy is the government’s choices about taxes, spending, and borrowing. It is made by Congress and the president through laws: budgets, tax bills, and spending bills. Monetary policy, covered in What Does the Fed Do?, is made by the Federal Reserve, which sets interest rates. The two work on the same economy but through different doors. Monetary policy changes the price of borrowing. Fiscal policy changes how much the government buys, how much it hands out, and how much it takes in taxes.
Fiscal policy has more than one goal. Most of the budget pays for things voters want for their own sake, such as national defense, retirement income, and health care for older Americans. Using the budget to steady the economy, by cutting taxes or raising spending in a slump, is only one use of it, and the one this reading takes up in Explain It.
2 What the government buys
The table shows the largest categories of federal spending in fiscal year 2026.
| Category | FY2026 | What it pays for |
|---|---|---|
| Social Security | $1.67 trillion | Monthly benefits for retired workers, people with disabilities, and survivors |
| Medicare | $1.07 trillion | Health insurance for people 65 and older |
| Net interest | $1.05 trillion | Interest on the debt held by the public, minus interest the government earns |
| Health (mostly Medicaid) | $1.03 trillion | Medicaid, the Children’s Health Insurance Program, subsidies for marketplace insurance, and public health |
| National defense | $965 billion | The armed forces, weapons, and military pay |
| Income security | $694 billion | Food assistance, unemployment insurance, refundable tax credits, and federal retirement |
| Veterans | $416 billion | Veterans’ health care and benefits |
| Transportation and education | $251 billion | Highways, air travel, schools, and student aid |
Notice what tops the list. Net interest, at about $1.05 trillion, now costs more than national defense. And notice what isn’t near the top. Highways, schools, national parks, and foreign aid, the things many people picture when they think of government, are small slices of the federal budget. Much of that work is done by state and local governments, with their own budgets.
Economists sort spending in two useful ways. The first is by what the money does:
- Purchases are goods and services the government buys, such as a fighter jet or a park ranger’s time. They count in GDP, as the reading on measuring the economy explains.
- Transfers are payments to people for which the government receives no good or service in return, such as Social Security checks or food assistance. They don’t count in GDP directly, because they move income from one person to another rather than producing something. They count when the people who receive them spend the money.
Most federal spending is transfers. Social Security, Medicare, health programs, and income security alone are about 60 percent of the total.
The second way sorts spending by how Congress controls it:
- Mandatory spending is set by existing laws, such as the Social Security Act. It flows automatically to everyone who qualifies, and changes only if Congress changes the law. It was about 60 percent of federal spending in 2024.
- Discretionary spending is set each year in appropriations bills. Defense, highways, research, and the running of most agencies fall here. It was about 26 percent of spending.
- Net interest was the remaining 13 percent. It is owed on past borrowing and can’t be skipped without default.
That split matters. The budget fights that make the news are mostly about the discretionary quarter. The largest and fastest-growing parts of the budget run on autopilot unless Congress rewrites the underlying laws.
READ Understanding the Federal Budget (Page One Economics, Federal Reserve Bank of St. Louis, November 2025)
3 Where the money comes from
The federal government raised about $5.4 trillion in fiscal year 2026. Two taxes on earnings provided nearly nine dollars of every ten.
| Source | FY2026 | Share of receipts |
|---|---|---|
| Individual income taxes | $2.85 trillion | About 53 percent |
| Payroll taxes (Social Security, Medicare, unemployment insurance) | $1.81 trillion | About 34 percent |
| Corporate income taxes | $381 billion | About 7 percent |
| Customs duties (tariffs) | $173 billion | About 3 percent |
| Excise taxes (gasoline, alcohol, tobacco, airline tickets) | $106 billion | About 2 percent |
| Estate and gift taxes, Fed earnings, and other | $86 billion | About 2 percent |
Customs duties were lower in 2026 than in 2025, even though many tariffs were higher. In February 2026, the Supreme Court ruled that a 1977 emergency-powers law does not authorize tariffs, and the government began refunding about $165 billion collected under it. The tariff readings, Who Pays for Tariffs? and Is the Trade Deficit a Problem?, cover tariffs in depth.
The graph puts the two sides of the budget next to each other.
State and local governments raise money differently. In 2021, they collected about $4.1 trillion in general revenue. Property taxes were their largest tax, at 15 percent of that revenue, followed by individual income taxes at 13 percent and general sales taxes at 12 percent. Another 27 percent came from the federal government as grants. Local governments lean hardest on the property tax, which provided 30 percent of their revenue. Several states have no broad income tax on wages, and a few have no general sales tax, so the mix varies a great deal from state to state.
4 Types of taxes and tax systems
Every tax has a base, the thing being taxed, and a rate. The main bases are income (wages, profits, interest, and gains), consumption (sales and excise taxes, tariffs), and wealth or property (property and estate taxes). A tax’s base shapes whom it falls on and what it discourages.
Economists also sort tax systems by how the share of income paid changes as income rises:
| System | What happens as income rises | Example |
|---|---|---|
| Progressive | The share of income paid in tax rises. | The federal individual income tax, with seven rates from 10 to 37 percent and refundable credits at the bottom |
| Proportional (flat) | The share of income paid stays the same. | A state income tax with a single rate, as some states have; Medicare’s 2.9 percent payroll tax on all wages |
| Regressive | The share of income paid falls. | Sales and excise taxes, because lower-income families spend a larger share of what they earn |
Two ideas help in reading any tax system:
- Marginal versus average rates. The marginal rate is the tax on the next dollar earned. The average rate is total tax divided by total income. Moving into a higher bracket raises the rate only on the dollars above the line, not on everything you earn, so a raise never lowers take-home pay through the bracket system alone. The marginal rate shapes choices about working more; the average rate shows the overall burden.
- The payroll tax cap. Workers and employers each pay 6.2 percent of wages for Social Security, but only on the first $184,500 of a worker’s wages in 2026, rising to $192,300 in 2027. Above the cap, the Social Security tax stops. Medicare’s 2.9 percent has no cap, and a 0.9 percent surtax applies to high earners. Because of the cap, the payroll tax takes a smaller share of income from people who earn far above it.
Whether a whole tax system is progressive depends on all its taxes and credits together, not on any one of them. A regressive sales tax can sit inside a progressive system if the income tax and credits more than offset it. Section 7 looks at the evidence for the federal system as a whole.
WATCH Progressive vs. Flat Tax Explained (Marginal Revolution University)
5 Deficit versus debt
The deficit is the gap between spending and revenue in one year. The debt is the total of past borrowing that hasn’t been repaid. A deficit is like the amount by which a household overspends this year; the debt is like the balance on its credit card. When the government runs a deficit, the debt grows. The government would need a surplus to pay debt down, and it last ran one in 2001.
In fiscal year 2026, the deficit was about $2.0 trillion, up from $1.8 trillion in 2025. The Congressional Budget Office (CBO), the nonpartisan agency that scores the budget for Congress, projects debt held by the public at about $32 trillion this year, 101 percent of GDP. That is the debt owed to investors outside the federal government, including the Federal Reserve. Is the National Debt a Problem? explains why economists focus on debt held by the public, and why the size of the debt compared with the economy matters more than the dollar total.
Measure It: Reading the Budget
6 How big is the federal budget?
Dollar totals grow every year because prices and the economy grow. To compare across years, economists measure the budget as a share of GDP. In fiscal year 2025, federal spending was 23.1 percent of GDP and revenue was 17.2 percent. Over the past 50 years, spending averaged 21.2 percent and revenue 17.3 percent.
Those numbers say something important. Revenue today is close to its long-run average. Spending is about two percentage points above its average, and the gap is growing as more Americans retire and health costs and interest rise. CBO projects deficits of about 6 to 7 percent of GDP over the next decade, even with the economy at full employment, and debt held by the public reaching 120 percent of GDP in 2036, above the previous record of 106 percent in 1946.
Some deficit is ordinary. The United States has run deficits in most years since 1970. What CBO and most economists find unusual is the size of the deficit with unemployment low. In the past, deficits of this size came during wars and deep recessions.
7 Who pays?
The question sounds simple, but the answer depends on which taxes you count. Two well-known measures give different numbers, and both are correct.
- All federal taxes. CBO counts income, payroll, corporate, and excise taxes. In 2023, the top 1 percent of households by income paid 26 percent of all federal taxes. The top fifth paid 70 percent.
- Federal income taxes only. IRS data on individual income tax returns, compiled by the Tax Foundation, show that the top 1 percent of taxpayers paid 38.4 percent of federal individual income taxes in 2023, while earning 20.6 percent of the income reported. The share has ranged between about 38 and 46 percent in recent years. The bottom half of taxpayers paid 3.3 percent, while earning 12.3 percent of the income.
Why the difference? The income tax is the most progressive federal tax, so counting it alone gives the largest share for the top. The payroll tax, the second-largest source of revenue, falls mostly on wages up to the cap. Many lower- and middle-income workers pay more in payroll tax than in income tax, and some pay no income tax at all after credits. When payroll taxes are added, the bottom and middle pay a larger share of the total, and the top 1 percent’s share falls. The two measures also count households a little differently. Sometimes you will hear an even higher figure, such as 42 or 46 percent. That is the income-tax share from 2020 or 2021, when high incomes from investments surged.
A share of taxes paid can be large because a group pays high rates, because it earns a large share of income, or both. So economists also look at average tax rates: total federal taxes as a share of each group’s income.
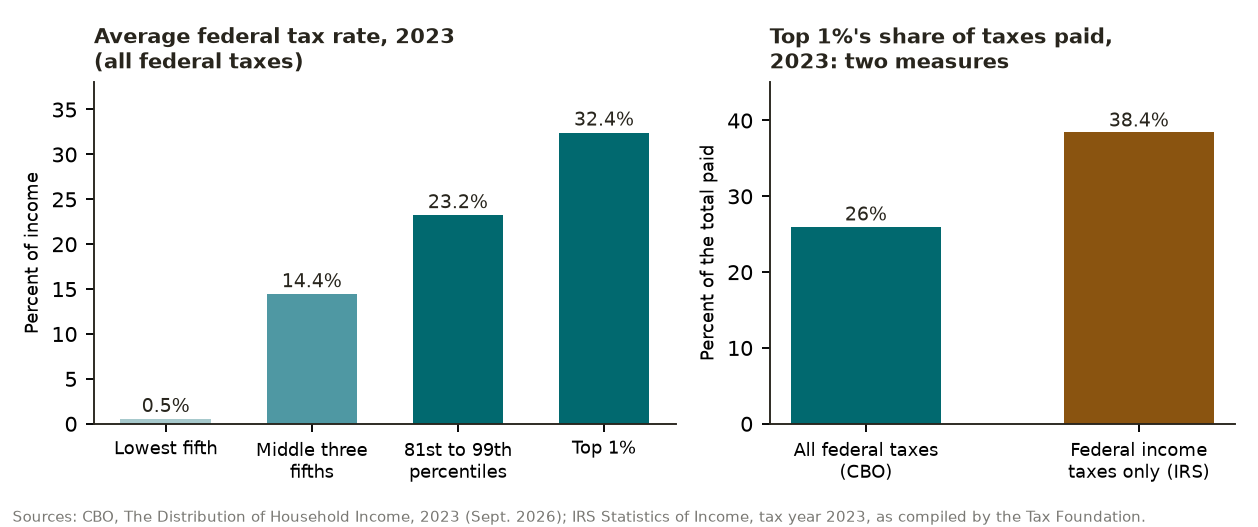
Average rates rise from 0.5 percent for the lowest fifth to 32.4 percent for the top 1 percent. The income tax by itself ranges from minus 11 percent for the lowest fifth, because refundable credits such as the Earned Income Tax Credit pay out more than those households owe, to 16 percent for the top fifth. By CBO’s measure, average federal tax rates have fallen for every income group since 1979, while the share of taxes paid by the top has risen, mainly because the top’s share of income has risen. The reading How Unequal Is America? looks at that trend.
There is one more step: who really bears a tax is not always who sends the money to the government. Economists call this incidence. Employers send in half of the payroll tax, but CBO, the Treasury, the Joint Committee on Taxation, and the Tax Policy Center all assume that workers bear both halves, through lower wages. The reason is shown in the diagram. Most people work about the same amount whatever the wage, so labor supply responds little to the wage. When a tax drives a wedge between what employers pay and what workers keep, the side that responds less ends up bearing more.
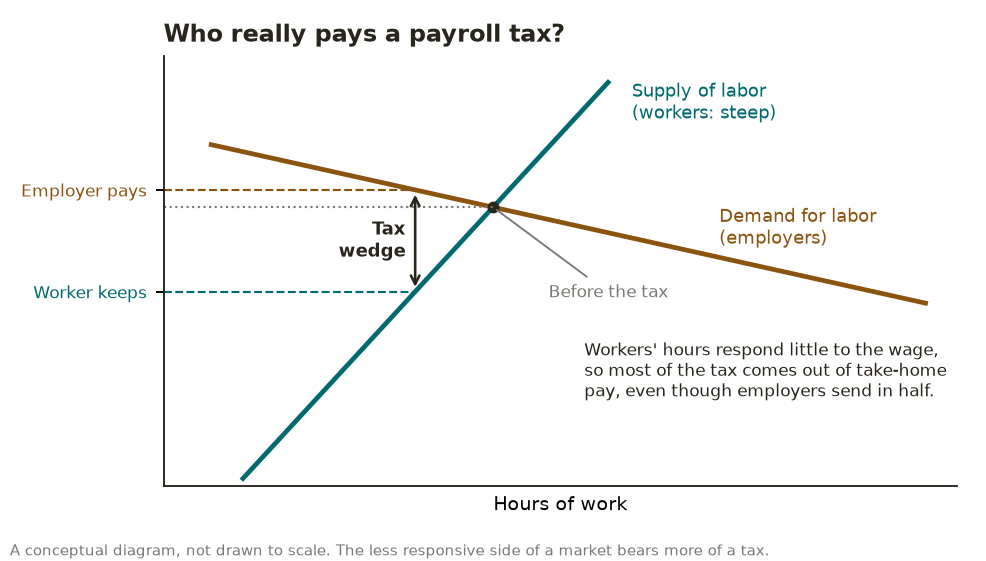
The same logic applies to the corporate tax, where economists debate how much falls on shareholders, workers, and owners of capital in general, and to tariffs and gasoline taxes. Incidence is why the analysis in this section relies on estimates and assumptions, and why careful analysts state theirs.
WATCH Who Pays the Tax? (Marginal Revolution University)
8 How the Treasury borrows
When spending exceeds revenue, the Treasury Department borrows by selling securities at auction. Anyone can buy them, from a pension fund in Tokyo to a family in South Carolina using the TreasuryDirect website.
| Security | Term | How it pays |
|---|---|---|
| Treasury bills | 4 weeks to 1 year | Sold at a discount and repaid at face value; the difference is the interest |
| Treasury notes | 2 to 10 years | Fixed interest every six months, then face value at maturity |
| Treasury bonds | 20 or 30 years | Fixed interest every six months, then face value at maturity |
| TIPS | 5, 10, or 30 years | Principal adjusts with consumer prices, protecting buyers from inflation |
| Floating rate notes | 2 years | Interest rises and falls with the rate on 13-week bills |
Bills are auctioned every week, and notes, bonds, TIPS, and floating rate notes on a regular monthly or quarterly schedule. The Treasury announces its plans each quarter. On November 4, 2026, it said it would sell $125 billion of notes and bonds in mid-November to replace about $97 billion coming due, raising about $28 billion of new cash, and that it expects to keep the sizes of these auctions unchanged for at least the next several quarters. Treasury bills, about $7.4 trillion, now make up about 23 percent of the marketable Treasury debt. Borrowing short is often cheaper, but it means more debt must be refinanced each year at whatever rates prevail.
Who holds the debt? Foreign investors held about $9.3 trillion of Treasury securities in August 2026, about $3.8 trillion of it held by foreign governments and central banks. Japan was the largest foreign holder, at about $1.07 trillion, followed by the United Kingdom, at about $1.01 trillion. China’s holdings, about $590 billion, were the lowest in 18 years. The Federal Reserve held about $4.6 trillion. Most of the rest is held by Americans: mutual funds, banks, pension funds, insurance companies, state and local governments, and individuals. When the government pays interest, most of it goes to these domestic holders.
Because investors around the world treat Treasury securities as the safest dollar asset, the United States can borrow large sums at relatively low rates. That trust is valuable, and, like any reputation, it depends on being kept. Is the National Debt a Problem? discusses what could change it.
Explain It: What Fiscal Policy Can and Cannot Do
9 Options in recession, inflation, and stagflation
In the aggregate demand and aggregate supply model from What Causes Booms and Busts?, fiscal policy works mainly on demand. Lower taxes and higher spending can add to demand. Higher taxes and lower spending can subtract from it. The right move depends on the problem.
| Problem | The usual fiscal response | What can go wrong |
|---|---|---|
| Recession (demand falls, unemployment rises) | Expansionary policy: cut taxes, send checks, extend unemployment benefits, or speed up spending | By the time a law passes and the money is spent, recovery may already be under way. Borrowing adds to the debt. |
| Inflation from too much demand | Contractionary policy: raise taxes or cut spending to cool demand | Rarely tried for this purpose, because it is politically hard. In practice the Fed usually takes the lead. |
| Stagflation (prices up, output down, often from a supply shock) | No easy answer. Adding demand worsens inflation; cutting demand worsens the slump. Targeted relief for those hit hardest, or policies that expand supply, are the options most often discussed. | Relief that adds to demand can push prices higher. Supply measures take years to work. |
The 2026 oil shock offers a live example. With gasoline prices up sharply, members of Congress have proposed suspending the federal gas tax, 18.4 cents a gallon on gasoline and 24.4 cents on diesel. Congress has not suspended it since the Highway Trust Fund was created in 1956. Economics offers three questions to ask about a gas tax holiday:
- Who gets the savings? With refineries running near capacity and supply short, sellers may keep part of the tax cut as higher prices. Studies of past state holidays find that pump prices fall, but often by less than the full tax.
- What does it cost? The federal gas tax raises about $2.4 billion a month, money that mostly goes to the Highway Trust Fund. A holiday would be paid for with more borrowing or a transfer from other revenue.
- What does it do to demand? A lower pump price encourages people to buy more gasoline at the moment supply is tight. That works against the price signal telling people to conserve, the same signal the reading Why Are Gas Prices So High? describes.
Other proposals, such as a deduction for commuting costs, raise similar questions. None of this settles whether relief is worth it. That depends on how much weight one puts on helping families hit by a price spike now, compared with cost, timing, and incentives.
10 Automatic stabilizers
Some fiscal policy happens without anyone voting. Automatic stabilizers are parts of the budget that push against the business cycle on their own:
- Taxes fall in a slump. When incomes and profits drop, income and payroll tax collections drop faster, because the income tax is progressive. That leaves households more of what they earn.
- Spending rises in a slump. More people qualify for unemployment insurance, food assistance, and Medicaid, so spending on them rises without new legislation.
- Both reverse in a boom. Revenue rises and safety-net spending falls, which cools demand a little.
Automatic stabilizers avoid the biggest problem with discretionary fiscal policy: delay. They begin working as soon as incomes change, and they shut off by themselves as the economy recovers. Their size can be large. CBO estimates that in 2009, during the Great Recession, they added about 1.9 percent of potential GDP to the deficit. With the economy near full strength, CBO expects them to reduce deficits slightly, by about 0.2 percent of potential GDP in 2026 through 2029.
11 Does fiscal policy work?
Should Government Fight Recessions? covers this question in depth. In short:
- The multiplier. A dollar of government spending or tax relief can raise GDP by more or less than a dollar. Estimates differ widely, and the effect seems larger in deep recessions, when many people and machines are idle and interest rates are near zero, and smaller near full employment.
- Crowding out. Government borrowing can raise interest rates and reduce private investment, especially when the economy is near capacity. Then fiscal stimulus mostly changes who uses resources, not how many are used.
- Lags. Recognizing a recession, passing a law, and getting money out the door can take many months, sometimes more than a year.
- Expectations. If households expect today’s deficits to mean higher taxes later, they may save part of a tax cut rather than spend it.
So fiscal policy tends to work best when it is timely, temporary, and targeted: when a slump is deep, interest rates are already low, the money reaches people likely to spend it, and the policy ends as the economy recovers. It works least well near full employment, when inflation is already high, when the Fed is raising rates to offset it, or when large debts make investors nervous.
WATCH The Limits of Fiscal Policy and Fiscal Policy and Crowding Out (Marginal Revolution University)
12 Should the budget be balanced by law?
The federal government has no legal requirement to balance its budget. Almost every state does. Forty-nine states have some balanced-budget requirement; Vermont is the exception. The rules vary. In 2021, 44 states required the legislature to pass a balanced budget, and 35 barred carrying a deficit into the next year. State rules usually cover operating budgets only, so states can still borrow for roads and buildings, and they save in rainy-day funds for downturns.
Many proposals would add a balanced-budget requirement to the U.S. Constitution. On March 18, 2026, the House voted 211 to 207 for one such amendment, short of the two-thirds a constitutional amendment needs. That version would have limited spending in each year to the average of the previous three years’ revenue, adjusted for population and inflation. It allowed exceptions by a two-thirds vote or in a declared war and required a two-thirds vote to raise taxes.
The case for a rule draws on public choice economics. In Democracy in Deficit (1977), James Buchanan and Richard Wagner argued that before the 1930s, an unwritten rule of balanced budgets restrained politicians, and that once Keynesian economics removed that rule, deficits became the norm. Spending brings visible benefits to voters today, while the cost of borrowing falls on future taxpayers, many of whom can’t vote yet. Buchanan described this as politicians’ “natural proclivity” to run deficits, and argued that only a constitutional rule could restrain it. Supporters add that most states live with balanced-budget rules and still function.
The case against focuses on recessions. When the economy slumps, revenue falls and safety-net spending rises. A strict annual balance rule would force Congress to raise taxes or cut spending at exactly the wrong time. The Center on Budget and Policy Priorities, a left-leaning research group, argues that a balanced budget amendment “effectively suspends the automatic stabilizers” and would make recessions deeper. Critics also point out that states can balance their budgets partly because the federal government doesn’t, and sends them aid in downturns. And a rule doesn’t say what to cut or tax, so the hard choices remain.
There are middle paths. Swiss voters approved a debt brake in 2001, and it took effect in 2003. It limits spending to the revenue the government would collect in a normal year, so the budget can run deficits in recessions and must run surpluses in booms. Overruns go into a compensation account that must be paid down later, and an escape clause covers emergencies. International Monetary Fund researchers found that Swiss debt fell while the brake still allowed the budget to respond to the business cycle. Rules of this kind try to keep the discipline of a balance requirement without disabling the automatic stabilizers.
13 What makes a good tax system?
Economists don’t agree on one ideal tax system, but they share a common set of tests, going back to Adam Smith:
- Efficiency. Every tax discourages something. A good system raises revenue while distorting choices as little as possible. Broad bases with low rates usually do better than narrow bases with high rates, because people have fewer ways to avoid them and the rates on any one choice are lower.
- Fairness. Economists distinguish vertical equity, how the burden changes as income rises, from horizontal equity, treating people with similar incomes alike. How progressive the system should be is a question of values that economics can inform but can’t settle.
- Simplicity. Filing taxes costs Americans a great deal of time and money. Complexity also creates loopholes that favor those who can afford tax planning.
- Transparency and stability. People should be able to see what they pay and plan around rules that don’t change every year.
Researchers at the Organisation for Economic Co-operation and Development (OECD) ranked taxes by how much they slow long-run growth. Recurrent taxes on property, mainly land and buildings, did the least harm. Consumption taxes came next, then personal income taxes. Corporate income taxes did the most harm, because they fall on investment, a key source of growth. The OECD also noted a trade-off: the taxes least harmful to growth tend to be the least progressive, so governments must weigh growth against equity.
A major British review led by the Nobel laureate James Mirrlees reached a related conclusion. It recommended judging the tax system as a whole: “not all taxes need be progressive as long as the overall system is.” It also recommended making the system more neutral, taxing similar activities alike. Many economists, on both the left and the right, have favored taxing consumption rather than income, because an income tax taxes saving twice: once when the income is earned and again on the interest it earns. Others answer that a consumption tax is hard to make progressive and would favor people who already have wealth. That debate is still open.
The Budget in the News
Several stories this fall come back to the questions in this reading.
A $2 trillion deficit. The Treasury reported a deficit of about $2.0 trillion for fiscal year 2026. CBO said revenue rose about 3 percent and spending about 6 percent, with interest costs among the fastest-growing items.
The 2025 tax and spending law. CBO estimated that the 2025 reconciliation act would add about $3.4 trillion to deficits over ten years, or about $4.1 trillion including interest. When it accounted for the law’s effects on the economy, the estimate rose slightly, to about $4.2 trillion, because higher interest rates outweighed the extra revenue from faster growth.
Tariff refunds. After the Supreme Court’s February ruling, the government began refunding about $165 billion in tariffs, and customs revenue fell from $195 billion in 2025 to $173 billion in 2026.
A balanced budget amendment. The House vote in March fell short of two-thirds, as section 12 describes.
Gas prices. Congress returns on November 9 with several proposals for fuel-price relief, including a gas tax holiday and a commuter deduction, as section 9 describes.
Fair Challenges
Decide what you think of each challenge first, then open the response.
“The rich don’t pay their fair share.”
“Tax cuts pay for themselves.”
“Stimulus always works.”
“A family must balance its budget, so the government should too.”
“Tariffs can replace the income tax.”
Economists also disagree among themselves. Three live debates:
- How big is the multiplier when debt is high? Some economists argue that with debt above 100 percent of GDP, more borrowing raises interest rates and worries about future taxes enough to weaken any boost. Others find that stimulus still works in deep recessions, and that letting a slump drag on can harm public finances more than borrowing does.
- Are payroll taxes taxes or contributions? Payroll taxes look regressive because of the cap. But Social Security benefits are also capped, and the benefit formula is progressive, returning a larger share of past earnings to lower earners. Some economists say the tax and the benefit should be judged together; others say the tax should be judged on its own, since benefits depend on future laws.
- Should we tax consumption instead of income? Supporters say a consumption tax would encourage saving and investment and raise growth. Critics say it would shift the burden toward lower- and middle-income families unless paired with rebates or credits, and would make the system harder to keep progressive.
Notice what evidence can settle and what it can’t. Who pays which taxes, how much a tax cut recovers through growth, how large a multiplier is, and how state and Swiss budget rules have worked are questions evidence can answer, even if the answers are uncertain. How progressive taxes should be, how large government should be, how much to borrow from future taxpayers, and whether to bind future Congresses with a constitutional rule are questions of values.
What Economics Adds
LISTEN How Can the Government Raise Revenues? on EconoFact Chats, November 1, 2026, with economists William Gale and John Sabelhaus of the Brookings Institution, Kyle Pomerleau of the American Enterprise Institute, and Daniel Shaviro of New York University. Economists from across the spectrum weigh the options for raising more federal revenue.
LISTEN Why Industrial Policy Is (Almost) Always a Bad Idea on EconTalk, with economist Scott Sumner, December 9, 2024, with transcript. Sumner makes the case against industrial policy and explains why he sees the deficits run since 2016 as unsustainable.
The Normative Question
A constitutional balanced-budget rule would bind every future Congress. Supporters see it as the only check strong enough to stop elected officials from spending today and sending the bill to people who can’t yet vote. Opponents see it as a rule that would deepen recessions and tie the hands of voters and their representatives when circumstances change. Between them lie rules like Switzerland’s, which aim for balance over the business cycle rather than every year. Should the Constitution require the federal government to balance its budget, and if so, what exceptions should it allow? A strict rule may bring discipline at the cost of flexibility. No rule leaves flexibility, at the risk of debt that keeps growing. Where you come down depends on how much you trust future Congresses and how you weigh today’s taxpayers against tomorrow’s.
Key Terms in Plain Words
- Fiscal policy
- The government’s decisions about taxes, spending, and borrowing.
- Transfer payment
- Money paid to people with no good or service received in return, such as Social Security.
- Mandatory spending
- Spending set by existing law that flows automatically to those who qualify.
- Discretionary spending
- Spending Congress sets each year in appropriations bills.
- Deficit
- The amount by which spending exceeds revenue in one year.
- Debt held by the public
- Total past federal borrowing owed to investors outside the federal government.
- Progressive tax
- A tax that takes a larger share of income as income rises.
- Regressive tax
- A tax that takes a smaller share of income as income rises.
- Marginal tax rate
- The tax on the next dollar of income.
- Average tax rate
- Total tax paid divided by total income.
- Tax incidence
- Who actually bears the cost of a tax, whoever sends in the payment.
- Payroll tax
- A tax on wages that pays for Social Security and Medicare.
- Automatic stabilizers
- Taxes and spending that rise or fall with the economy without new laws, steadying demand.
- Crowding out
- A fall in private spending or investment caused by government borrowing or spending.
- Treasury securities
- Bills, notes, and bonds the federal government sells to borrow.
- Balanced budget rule
- A law or constitutional provision requiring spending not to exceed revenue.
Sources
- Quotations, figures, examples, and videos in this sheet come from the sources below, current as of November 6, 2026.
- Budget Totals And The Budget Outlook
- U.S. Department of the Treasury, Bureau of the Fiscal Service, Final Monthly Treasury Statement for Fiscal Year 2026 (September 2026) fiscaldata.treasury.gov
- Congressional Budget Office, Monthly Budget Review: September 2026 cbo.gov
- Congressional Budget Office, Monthly Budget Review: July 2026 (customs duties) cbo.gov
- Congressional Budget Office, The Budget and Economic Outlook: 2026 to 2036 cbo.gov
- Congressional Budget Office, The Budget and Economic Outlook: 2026 to 2036, By the Numbers cbo.gov
- Federal Reserve Bank of St. Louis, Page One Economics, “Understanding the Federal Budget,” November 2025 stlouisfed.org
- Tax Policy Center, Briefing Book, “What Are the Sources of Revenue for State and Local Governments?” taxpolicycenter.org
- Taxes And Who Pays
- Congressional Budget Office, The Distribution of Household Income in 2023 cbo.gov
- Internal Revenue Service, Statistics of Income, Individual Statistical Tables by Tax Rate and Income Percentile irs.gov
- Tax Foundation, “Summary of the Latest Federal Income Tax Data,” tax year 2023 (tabulation of IRS data) taxfoundation.org
- Social Security Administration, 2026 Cost-of-Living Adjustment Fact Sheet (maximum taxable earnings) ssa.gov
- Social Security Administration, Contribution and Benefit Base (2027 base) ssa.gov
- Congressional Budget Office, how CBO allocates the payroll tax in distributional analysis cbo.gov
- U.S. Department of the Treasury, Office of Tax Analysis, Technical Paper 8, distribution methodology home.treasury.gov
- Borrowing And Who Holds The Debt
- U.S. Department of the Treasury, Quarterly Refunding Statement, November 4, 2026 home.treasury.gov
- U.S. Department of the Treasury, Treasury Borrowing Advisory Committee charges and charts, fourth quarter 2026 home.treasury.gov
- U.S. Department of the Treasury, Treasury International Capital data, Major Foreign Holders of Treasury Securities ticdata.treasury.gov
- U.S. Department of the Treasury, Treasury International Capital data release for August 2026 home.treasury.gov
- Federal Reserve Board, Factors Affecting Reserve Balances (H.4.1) federalreserve.gov
- Fiscal Policy, Stabilizers, And The 2025 Law
- Congressional Budget Office, The Effects of Automatic Stabilizers on the Federal Budget, 2026 to 2036 cbo.gov
- Congressional Budget Office, The Effects of Automatic Stabilizers on the Federal Budget, May 2010 cbo.gov
- Congressional Budget Office, dynamic estimate of the 2025 reconciliation act cbo.gov
- Congressional Budget Office, effects of tariff increases on deficits cbo.gov
- Gas Tax Holiday
- Congressional Research Service, report R48948 on the federal motor fuels tax congress.gov
- American Action Forum, “Examining the Costs of a Federal Gas Tax Holiday: An Update.” americanactionforum.org
- Federal Reserve Bank of Dallas, working paper on state gas tax holidays fedinprint.org
- Eno Center for Transportation, “Incoming Senators Float Gas Tax Holiday, But Lower Prices Rarely Follow.” enotrans.org
- CNBC, “Gas Tax Holiday, Commuter Deduction: Congress’ Fuel-Price Proposals,” September 22, 2026 cnbc.com
- Tariff Ruling
- White & Case, “United States Terminates IEEPA-Based Tariffs Following Supreme Court Decision.” whitecase.com
- American Bar Association, The Procurement Lawyer, “IEEPA Tariffs Struck Down,” Fall 2026 americanbar.org
- Balanced Budget Rules
- Congressional Research Service, report R44383 on balanced budget amendments congress.gov
- Congress.gov, H.J.Res.139, 119th Congress, all actions (House vote of March 18, 2026) congress.gov
- Congressional Record, March 18, 2026, text of H.J.Res.139 govinfo.gov
- Congress.gov, H.J.Res.17, 119th Congress, balanced budget amendment congress.gov
- National Conference of State Legislatures, “Late State Budgets” (balanced budget requirements) ncsl.org
- Tax Policy Center, Briefing Book, “What Are State Balanced Budget Requirements and How Do They Work?” taxpolicycenter.org
- James M. Buchanan and Richard E. Wagner, Democracy in Deficit: The Political Legacy of Lord Keynes (1977), Library of Economics and Liberty edition econlib.org
- Federal Reserve Bank of Minneapolis, “Interview with James Buchanan,” 1995 minneapolisfed.org
- Center on Budget and Policy Priorities, “A Balanced Budget Amendment Doesn’t Change the Math” (argument) cbpp.org
- International Monetary Fund, Staff Discussion Note 18/04, technical background papers on fiscal rules (Swiss debt brake) imf.org
- Swiss Federal Finance Administration, Working Paper 15, on the debt brake efv.admin.ch
- Tax Design
- OECD, Tax Policy Reform and Economic Growth (2010) oecd.org
- OECD, “Taxation and Economic Growth,” Economics Department Working Paper 620 (2008) oecd.org
- OECD, Tax Policies for Inclusive Growth in a Changing World (2018) oecd.org
- Institute for Fiscal Studies, Tax by Design: The Mirrlees Review (2011) ifs.org.uk
- James Mirrlees and others, “The Mirrlees Review: A Proposal for Systematic Tax Reform,” Fiscal Studies (2011) homepages.ucl.ac.uk
- Videos
- Marginal Revolution University, “Progressive vs. Flat Tax Explained.” youtube.com
- Marginal Revolution University, “Who Pays the Tax?” youtube.com
- Marginal Revolution University, “The Limits of Fiscal Policy.” youtube.com
- Marginal Revolution University, “Fiscal Policy and Crowding Out.” youtube.com
- Podcasts (With Transcripts)
- EconoFact Chats, “How Can the Government Raise Revenues?” November 1, 2026 econofact.org
- EconTalk, “Why Industrial Policy Is (Almost) Always a Bad Idea” (with Scott Sumner), December 9, 2024 econtalk.org